II. The Lean Marketing Stack
Using Google Analytics
Google Analytics is confusing
However, there are a few places where it shines:
- Tracking Visitors and Visits: if you want to see traffic numbers, especially in real-time, go to Google Analytics first.
- Tracking Bounce Rate, Time on Page, and Exits: again, Google Analytics’ strength is in visitor analytics. It’s easy to get data on bounce rate, how much time people have spent on particular pages, and at what point they’re leaving your site.
- Tracking Referrals: it’s helpful to know where your traffic is coming from! Google Analytics provides useful referral data, plus email alerts so that if you get a spike from a particular source, you’ll know right away.
UTM tracking
Adding UTM codes to your URLs allow you to track different campaigns in Google Analytics. You may have seen URLs with UTMs in the past. Here is an example:
This one came from Buffer, a tool I use to share links on social media. When someone clicks on that link and comes to my site, Google Analytics will analyze it like this:
- Medium: social – Describes the type of traffic. Examples: email, social, cost per click ads.
- Source: twitter.com – This is a label for where the traffic is coming from. Examples: search engine, newsletter name, Facebook, Twitter.
- Campaign: buffer – Identifies the slogan, product name, or promo code for this campaign.
- Content: buffer9d562 – The content tag is used to track multiple links when they point to the same URL.
Creating UTM links
You can craft these URLs by hand, but most folks use Google’s URL Builder.1
The bigger challenge is managing all the URLs you’ve created. I recommend using a spreadsheet to keep track of each URL. It should look something like this:
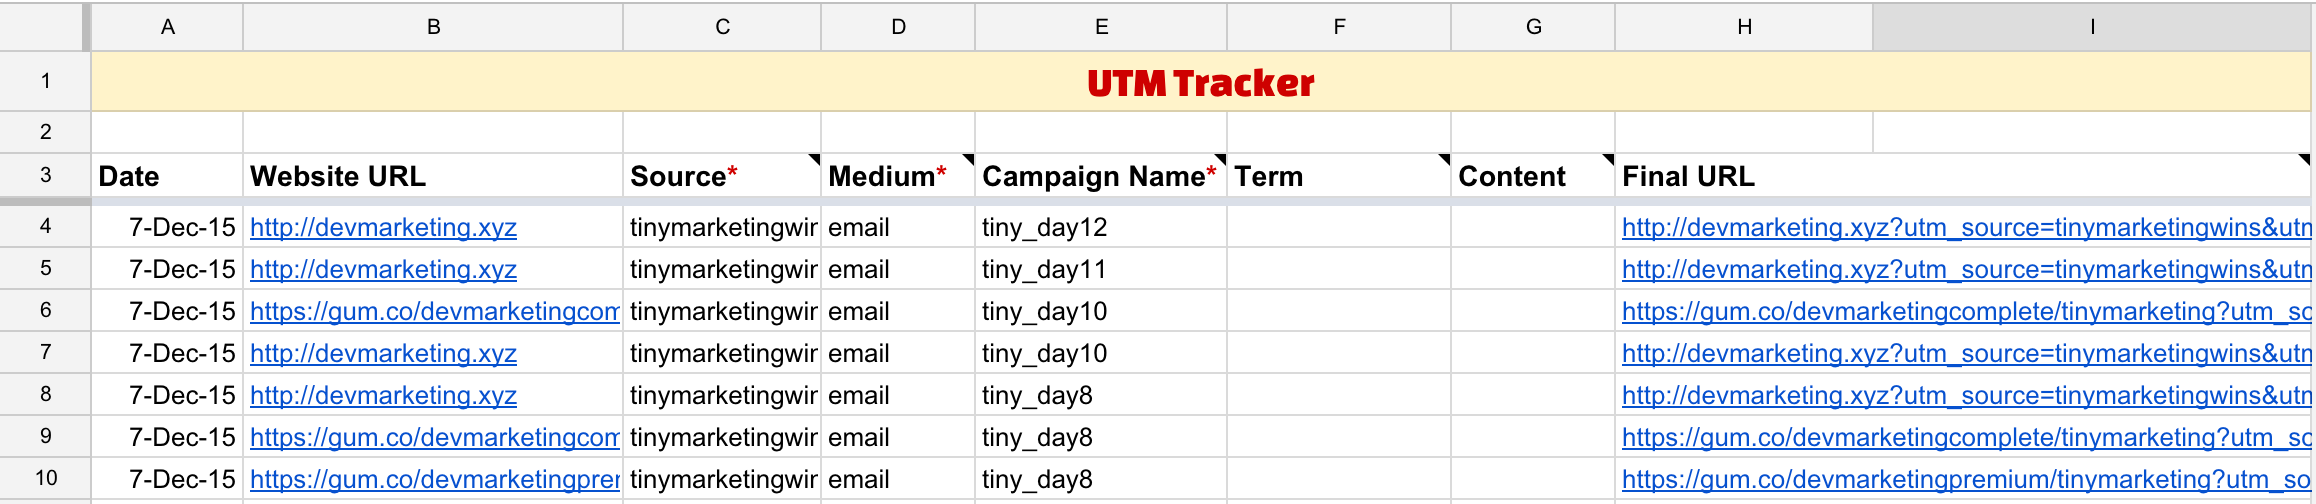
A copy of this UTM Tracker spreadsheet is included with this book
Generate your campaign URLs in this spreadsheet, and they’ll be saved for future use. This will ensure you don’t accidentally tag a campaign using the wrong variable names (i.e., blackfriday vs. black_friday).
Viewing UTM data in Analytics
If you regularly generate UTM links for your site, you’ll be able to filter by the Medium, Source, and Campaign variables in Analytics and create reports like this:
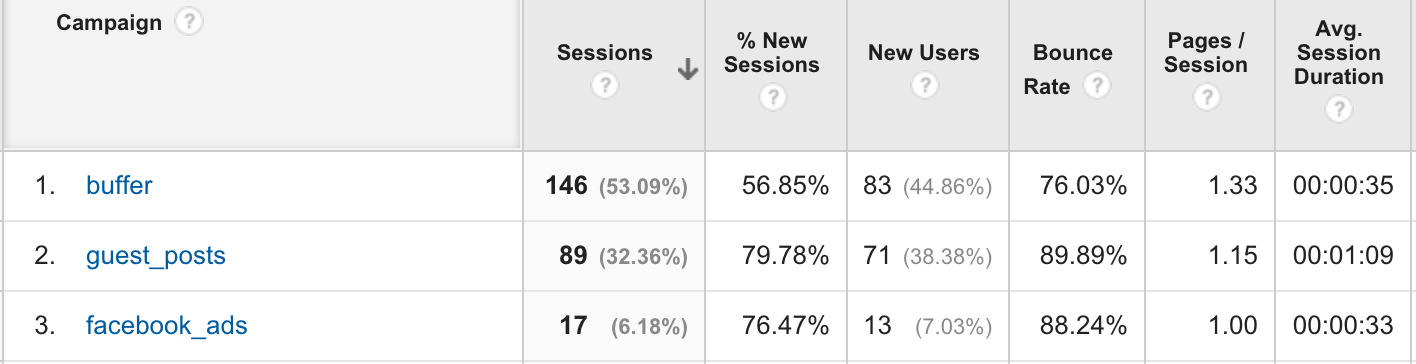
Report that shows visits filtered by Campaign
UTM information is particularly helpful in these reports:
- Acquisition > All Traffic > Source/Medium
- Acquisition > Campaigns > All Campaigns
- Conversions (you can filter by Source / Medium and Campaign)
If you’re doing a good job of tracking all your ad, social and content campaigns with UTM tags, you’ll be able to see which campaigns, sources, and mediums convert the best.
Viewing real-time stats
Want to know who’s on your site right now? Head over to the Real-time report and observe which referrers, social sites, or keywords are sending traffic, and which countries people are visiting from.
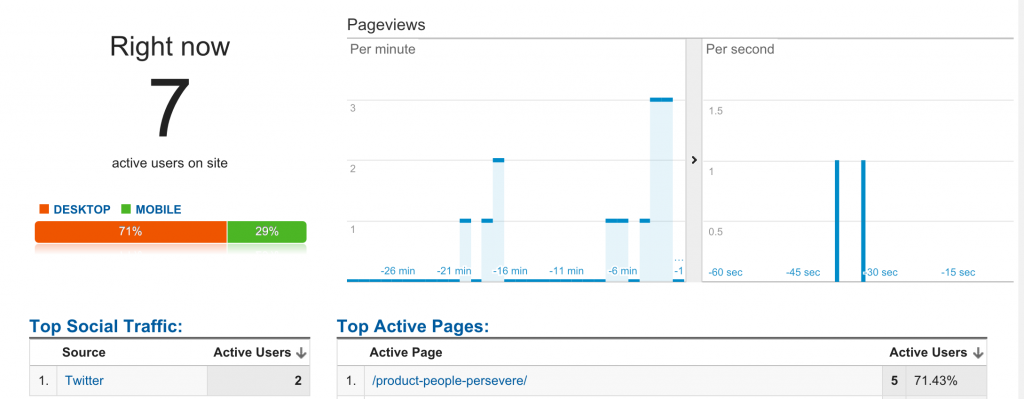
This report is particularly helpful if you notice a big influx of traffic and want to figure out where it’s coming from. It also gives you immediate feedback: send out a tweet, and you can see how much traffic it generates.
Acquisition
To start, the only chart you’ll want to pay attention to under Acquisition is the one you’ll find under All Traffic >> Source/Medium.
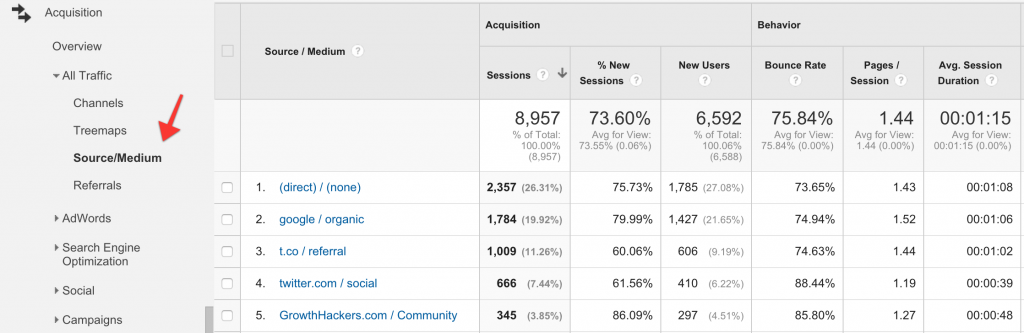
The Source side will describe which site the traffic originated from (google.com, twitter.com). The Medium side will show what kind of traffic it was:
- Organic - unpaid search traffic from Google
- CPC - Cost per Click advertising, paid search traffic from Google
- Referral - traffic from other websites
- Email - traffic from emails
- None - direct traffic (or unknown source)
Behavior
The oddly named Behavior report is an appraisal of your site’s content. When people talk about “vanity metrics” they’re often talking about stats in this section, because they focus on pageviews.
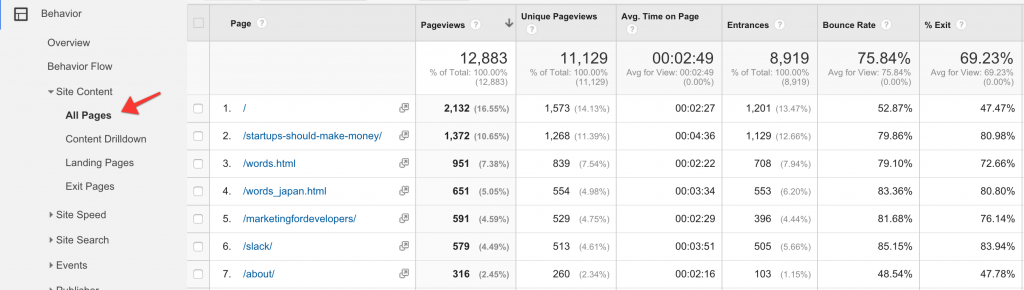
See your site’s most popular content
If you want to see your site’s most popular content, sorted by pageviews, go to Site Content >> All Pages. You will see total Pageviews in the second column, and Unique Pageviews in the third. Unique Pageviews only count a single pageview per visitor.
Setting up Goals
You have goals for your website. You want people to:
- sign up for your newsletter
- create a trial account
- buy a T-shirt
- download your app
- fill out your contact form
When you drive traffic to your site, your goal(s) is how you evaluate success. Google Analytics has a reporting feature (conveniently named Goals) for just this purpose.
To get started with Goals, follow these steps:
- Log into Google Analytics
- Click on the Admin link in the top menu
- In the third column (far right), click on Goals
- Click the red New Goal button
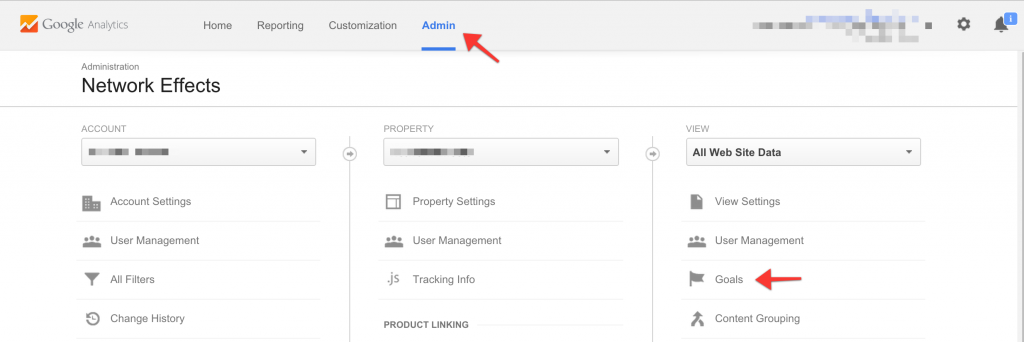
To find Goals, click Admin in the top menu, and Goals in the menu on the far right
Next, in your Goal setup, you’ll be able to choose a pre-made template (Reservations, Make a payment, Make an appointment) or choose a Custom setup. Most often I choose Custom.
After that, you’ll define the Goal description and type. There are four types to choose from:
- Destination: a site URL you’d like to track when viewed. Example: a confirmation page like /thank-you.html for email sign-ups.
- Duration: an amount of time you’d like to target. Example: 10 minutes.
- Pages/Screens per session: the number of pages you’d like to target. Example: 4 pages.
- Event: a particular action performed on your site. Example: played video.
Example: newsletter sign-up
Is increasing newsletters sign-ups important to you? In this case, your Goal would look like this:
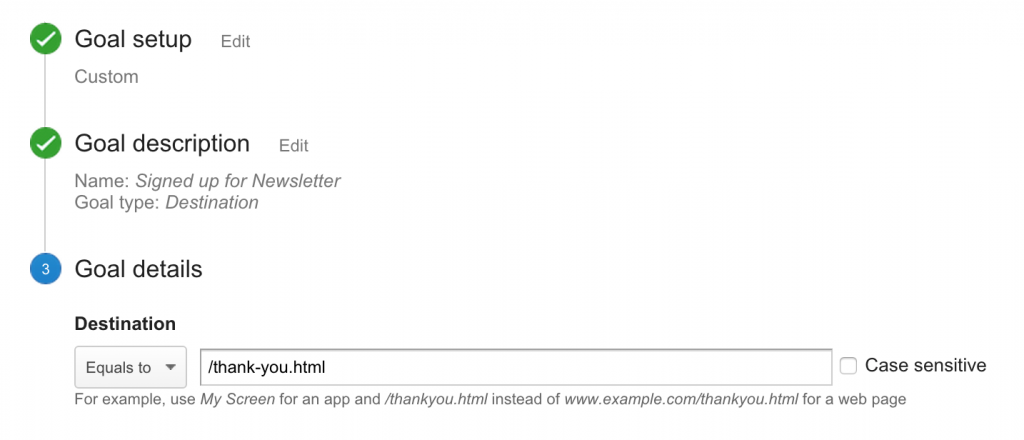
Goal: get visitors to sign up for newsletter
Note: don’t worry if your Goals don’t verify right away. In the above example, I knew I’d tested the destination page twice, but when I verified it, Google said the Goal had a 0% conversion rate. When I came back the next day, it had recorded my test visits.
“I’ve noticed this as well. Google’s goals don’t tend to update for up to 24 hours.”
- Mike Taber, The Single Founder Handbook
Now that we’ve set up this Goal, we can track it in Analytics. Here’s an example of my test visits:
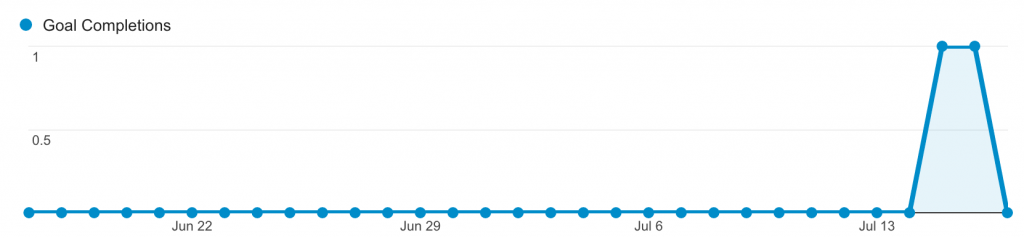
If you’ve set up your Goals correctly, you’ll start to see results in your Reports
Setting up a funnel
Creating a funnel
A funnel describes the steps it takes the user to get your Goal. Typically, you only use funnels in situations where customers are giving you money.
Although I prefer to track these in Mixpanel, you can also set up funnels in Google Analytics. You may want to do this to save money (if you move beyond Mixpanel’s free tier) or to compare Mixpanel’s results to Google’s.
To set up a funnel, go back to Admin >> Goals and edit your Goal. Flip the switch that says Funnel to on. Now, enter in the steps users will typically take to get to your goal. Don’t worry; these don’t have to be in exact order.
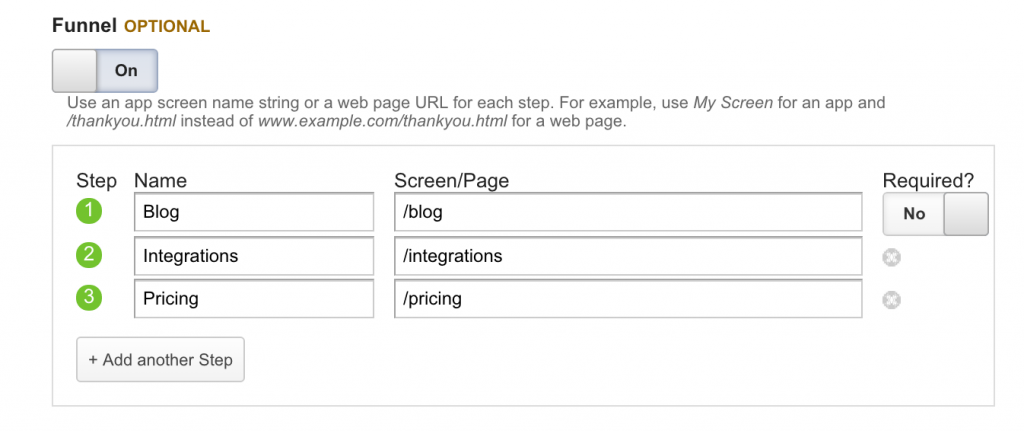
Here’s an example funnel for a SaaS product
Viewing a funnel
To view your funnel, go back to the Reporting tab and click on Conversions >> Goals >> Funnel Visualization or Goal Flow in the side menu.
Go to sleep: if you’re sure you’ve set everything up correctly, but Google’s showing a blank funnel, it probably hasn’t collected enough data. Turn your computer off and wait until tomorrow!
You’ll see each step of your funnel, and where you’re losing people. The funnel view looks like this:
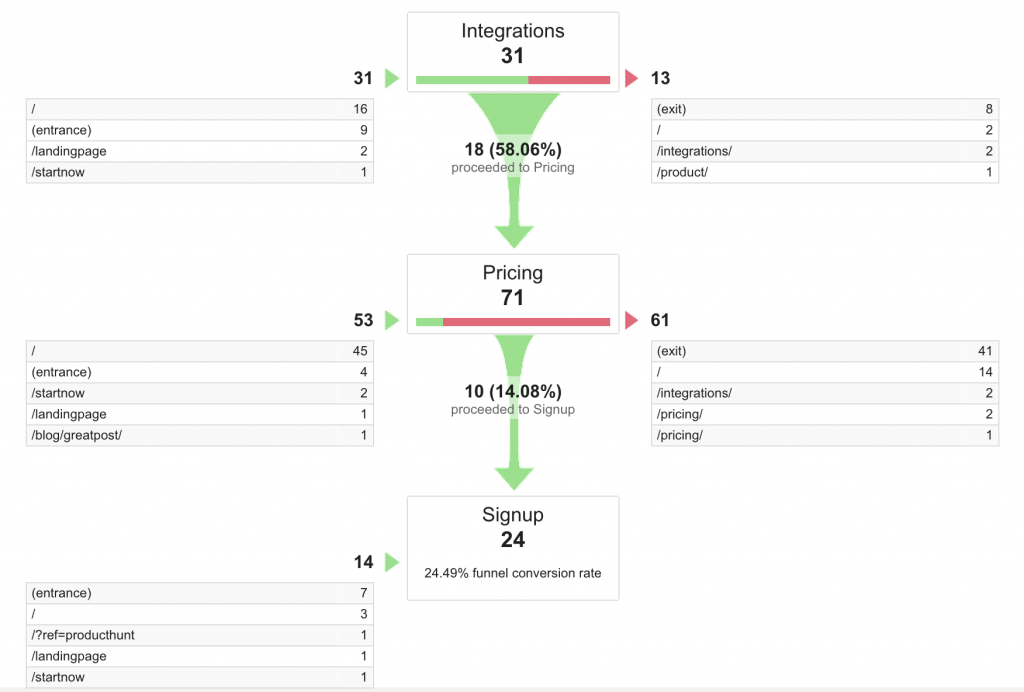
In this funnel, we can see that most people go straight to the Pricing page and that 14.08% continue to Signup.
The Goal Flow looks like this:
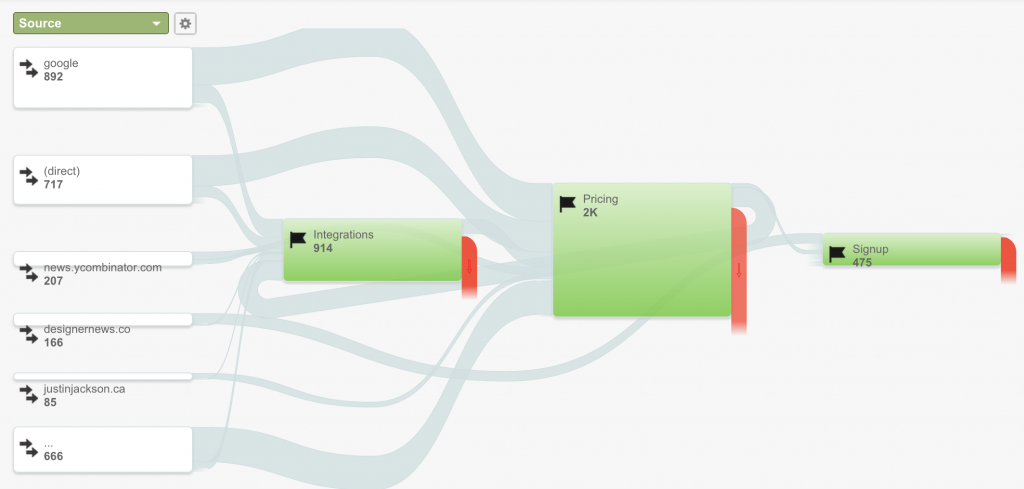
Google’s Goal Flow highlights how traffic moves through your funnel
View the steps it takes to achieve a goal
People typically don’t just type your website into their browser, add your product to the shopping cart, and buy. There are usually multiple touch points along the way. Most e-commerce reports only give credit to whatever the last referral was.
To see how each channel contributes to your overall conversions, go to Goals >> Multi-Channel Funnels.
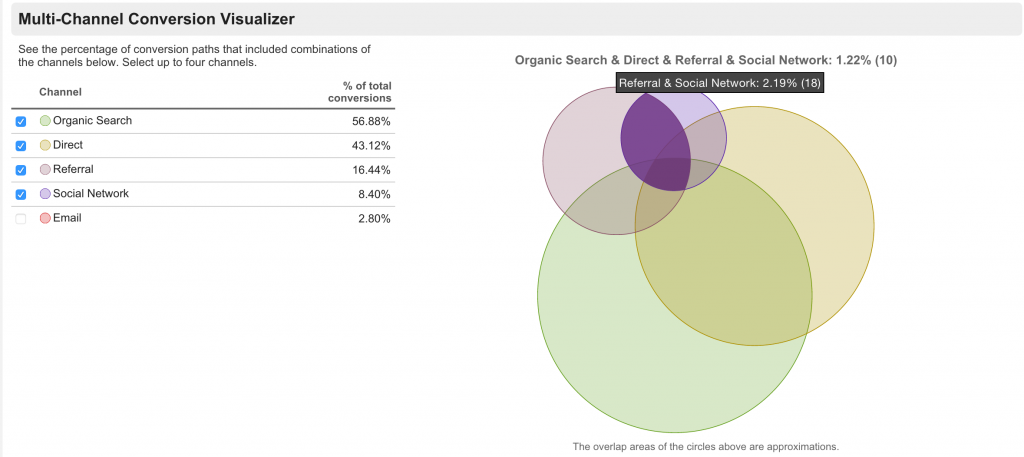
Multi-Channel Conversion Visualizer
Here, Google is giving you an idea of the path a visitor takes to become a customer. Be careful: by default Google will only show you interactions that occurred in the past 30 days. You can adjust this up to 90 days in the Lookback Window field at the top of each report.
A good way to evaluate the monetary value of different channels (especially if you’re running paid ad campaigns) is to view the Assisted Conversions report.
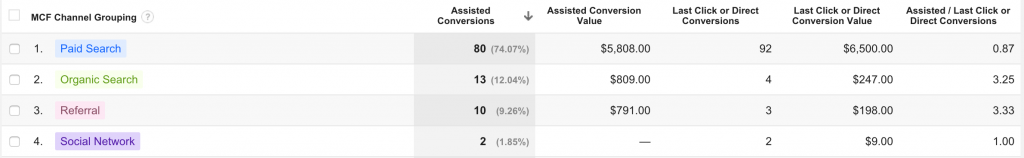
The Assisted Conversions report
In this example, we can see that Paid Search is driving the bulk of sales, and that leads from Social Networks are converting very little. This could be a signal to try something new with a channel that’s not working or to double down on a channel that’s converting well.
You can also click each of these channel groupings and drill down into specifics. If you click on Referrals, you will see the sites that sent you your best-converting traffic.
Footnotes
-
support.google.com/analytics/answer/1033867 ↩
Buy the EPUB & PDF to read offline and support the work.
Buy the book — $10